Visual Language#
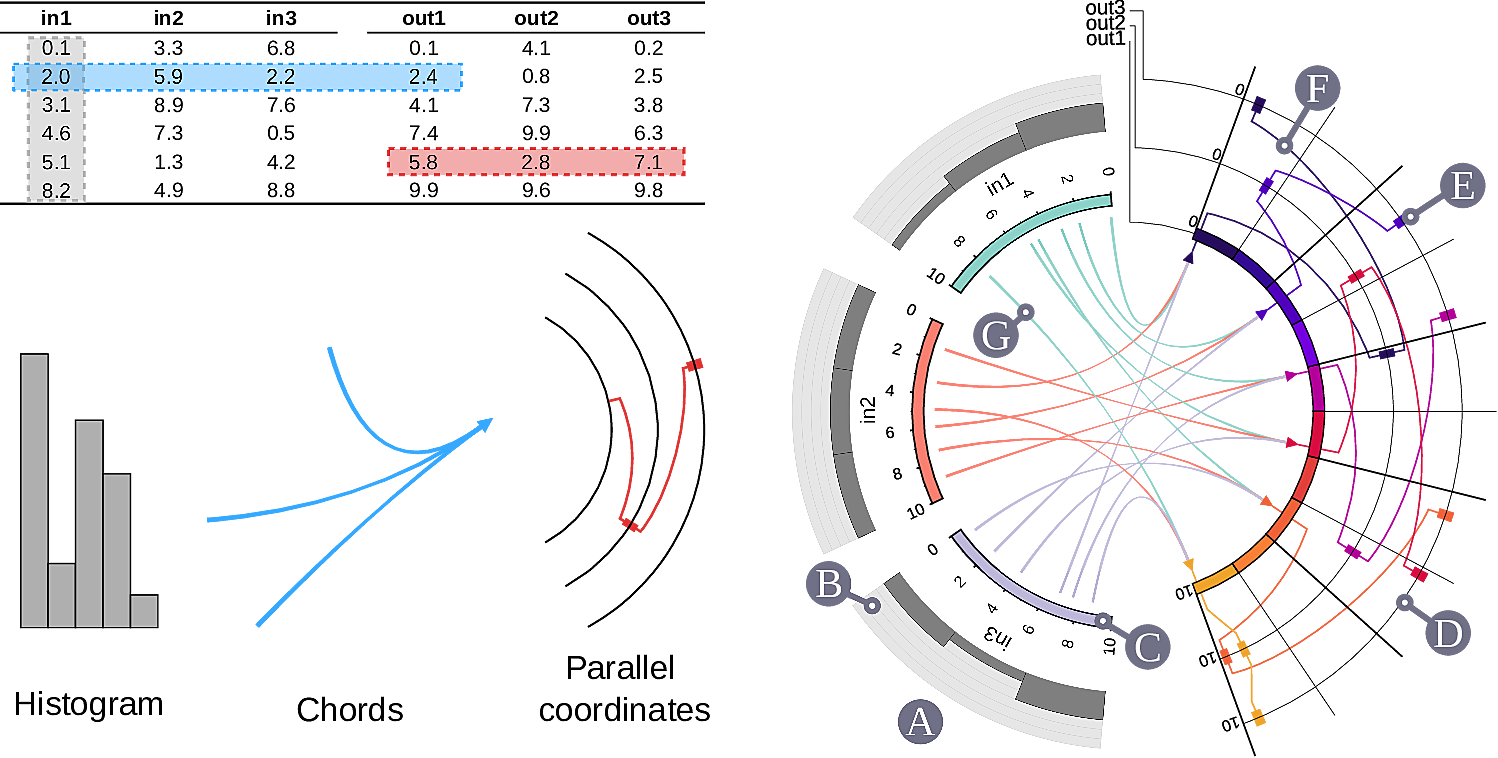
MooViE diagrams are called scenes. On the left of a MooViE scene, each input variable is represented in an individual circular segment, called input segment (A). Input segments consist of an arc being assigned a variable-specific color, name, range and possibly with unit (C). Optionally, each segment is equipped with a configurable histogram, showing the (marginal) distribution of the values of the respective input variable (B).
On the right, output variables are arranged in a single segment consisting of concentric arcs (output arcs), where each variable resides on a single arc (D). Like the input segments, output arcs have a name and a range. The output arc that is located closest to the center is called the primary output arc. This arc is an “attractor”, conflating the input values and connects them to the output values of the data items. For all but the primary output variable, boxes are placed on the output arcs according to their values within the data item (E). Neighboring boxes are connected by a polyline (F). The polyline and boxes share the same color, defined by the primary variable value.
The chords represent the relation between the input and the primary output variable, for all data items (G). The chords are connecting curves (bundles), drawn from each input segment to the primary output arc, where start and end-points of the chord bundle are given by the values of the associated input and primary output variables, respectively. Hence, all chords that belong to one data item meet at the same point of the primary output arc, where an arrow is placed. The chords of each data item share the same color with the input variable, while the color of the arrow is set to the color of the value on the primary output arc.